


OK, I got bored tonight and decided to play around with some programming. In the interest of full disclosure my only deco class has been what's covered in full cave so this could very easily be a stupid question, and my apologies if it is...I have plans to take a deco class sometime in the near future, just not sure of good instructors to take it with.
I've been writing a php script, and think I have it so that tissue loading is calculated properly. The script can be seen here-
http://jamesg.net/temp/deco_schedule...60&o2=21&he=35
You can modify the variables by changing depth=100 to depth=90, or swap gas mixes by changing &o2=21&he=35 to &o2=18&he=45 for 18/45...that's not really relevant, but feel free to test it and let me know if you see anything odd. Currently the ascent ceiling is calculated improperly because I don't have the He/n2 a&b values in my database.
OK, now for the stupid question(s)....
is the "Low GF" nothing more than something to change the first mvalue?
- For instance, if the ascent ceiling is at .5 bar, and my GF Low is .5, would the new mvalue be .25?
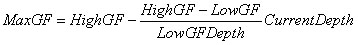
Once we know the low gf depth as derived from the mvalue*lowgf, can we then calculate the ascent ceiling as follows, and then make sure that no tissue ever exceeds (GF For Specific Depth * Mvalue)?-
(Image taken from RBW Gradient Factors tutorial)
Here's what I'm currently thinking...mvalue=100ft (whatever that is in bar), GFLOW=.35 GFHIGH=.85
Let's say our first stop is at 150ft with the gf adjustment
Then-
GF__ft deep (obviously in bar) = (.85-.35)/(150-100)*CurrentDepthInBar + .85
Thanks in advance for any help. I've been using JpGraph for some things at work (http://www.aditus.nu/jpgraph/), and the goal here is (aside from the fact I'm graduating and making portfolio material) to show graphs of how deco increases over time, as well as have optional gear failures (such as a dpv or lost deco bottle) that demonstrate how a few gear failures can really cut things close... it's an attempt to make dive plans appear more visual than just numbers on a paper.
The final plan is to overlay graphs of Ratio Deco and compare them to Buhl with GF's to debunk the myth that Ratio Deco is extremely aggressive, and maybe overlay VPM-B Buhl and Ratio Deco for easy comparison on a per-dive basis if I get real ambitious...the gas graphs will come first, since I already have the rock bottom functions written for ratio deco and most of that code can be reused for buhl,
Welcome to the Cave Diver's Forum.

 Reply With Quote


Bookmarks